
By Dr. Ramin Golbaghi · Updated October 2026
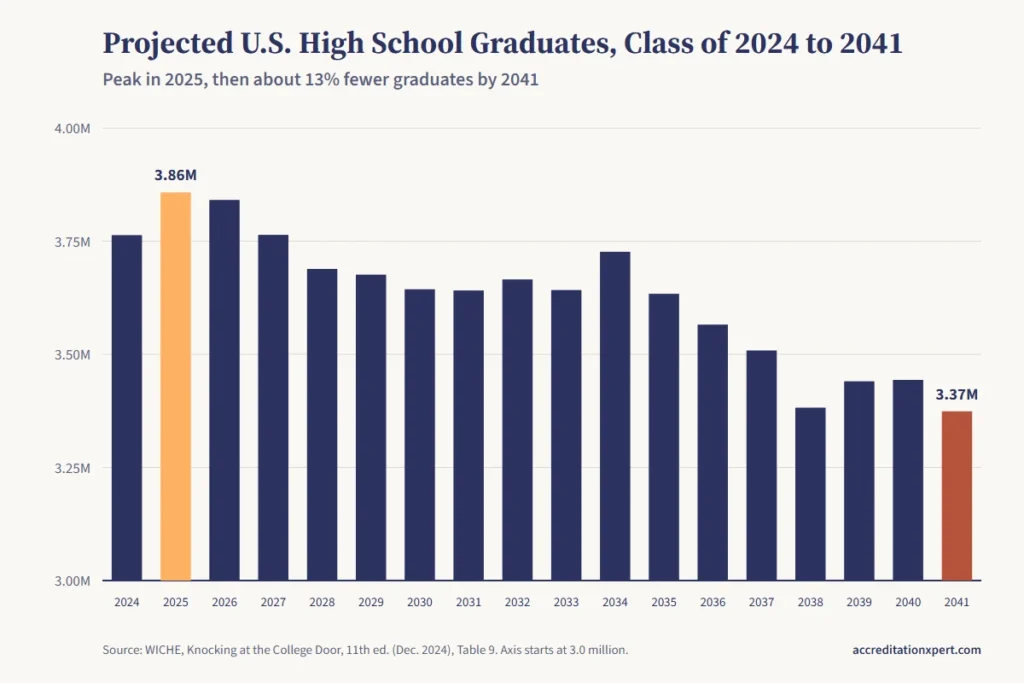
The enrollment cliff is the projected fall in the number of U.S. high school graduates, and so in traditional-age college students, that began after the class of 2025. The Western Interstate Commission for Higher Education (WICHE) projects a peak of about 3.9 million graduates in 2025 and about 13% fewer by 2041, a class of 2041 nearly 484,000 graduates smaller than the class of 2025.
The same trend is often called the demographic cliff. WICHE’s projections show a slope with flat stretches.
National enrollment did not fall in 2025–26: the National Student Clearinghouse counted 1.0% more students in fall 2025 and again in spring 2026. Private four-year colleges lost undergraduates in fall 2025, while community colleges and undergraduate certificates grew. For a private college or career school, the question is which of its own numbers fall first, and which of them its accreditor and state agency read.
This guide is for owners, presidents, academic leaders and compliance officers of private colleges and private career, vocational and allied health schools.
What Is the Enrollment Cliff?
The enrollment cliff is a demographic decline: fewer 18-year-olds, because fewer babies were born after the 2008 recession. WICHE’s 11th edition of Knocking at the College Door (December 2024) says students “born in 2008 and after (when births fell more sharply due to the Great Recession) will begin graduating from high school” after the 2025 peak. Its timeline:
- The class of 2025 is the largest on record: about 3.9 million graduates (3,857,783 in WICHE’s projection table).
- The class of 2026 is the first below the peak, at 3,841,094.
- The class of 2041 is projected at 3,373,947, about 13% smaller.
- WICHE projects “periods of projected relative stability,” for example from 2028–29 through 2034–35, before the steepest years in the late 2030s.
As WICHE’s president put it, “the bottom will not fall out overnight.” A school has years to adjust.
Enrollment Cliff Data: Projected High School Graduates, 2024 to 2041
The 2025 peak is followed by a drop of about 170,000 graduates in three years, a plateau near 3.65 million, and a second drop after 2035.
The Covid-19 pandemic is one reason WICHE gives for a lower curve than its previous edition expected. Through 2037, changes in K-12 enrollment add up to “about 750,000 fewer high school graduates compared to the previous projections.”
The college-going rate matters as much as the headcount. At the 62% rate WICHE uses (the 2022 rate), about 2.09 million of the class of 2041 would enroll right after high school. If the rate rose by half a point a year, the class of 2041 would send slightly more students to college than the class of 2024, a scenario WICHE itself calls “purely hypothetical and perhaps overly optimistic.”
Is College Enrollment Declining? The Latest Data
Enrollment trends in higher education are mixed: total U.S. college enrollment is not declining right now. It grew in fall 2024, fall 2025 and spring 2026, according to the National Student Clearinghouse Research Center, whose reporting institutions account for 97% of enrollments at Title IV degree-granting institutions.
Fall 2025 (final report, January 15, 2026):
- Total enrollment passed 19.4 million, up 1.0%. Undergraduates rose 1.2%.
- Undergraduate enrollment fell at private four-year institutions: down 1.6% at nonprofits and 2.0% at for-profits. Community colleges rose 3.0% and public four-year institutions 1.4%.
- First-year enrollment was flat (down 0.2%). Private four-year institutions each lost about 10,000 first-year students.
- Undergraduate certificate enrollment at community colleges reached 752,000, up 28.3% from fall 2021.
“Community colleges and public universities are gaining ground, while private colleges are down,” said Matthew Holsapple, the Clearinghouse’s senior director of research. In the fall 2025 report the undergraduate sector-level declines are at private colleges, while public four-year and community college enrollment grew. Colleges with declining enrollment in that report sit mostly in the private four-year sector; a university enrollment decline at a public institution is possible but is not the sector trend, and public master’s enrollment fell in spring 2026.
Spring 2026 (final report, June 4, 2026) kept the pattern: total enrollment of 18.6 million (up 1.0%), private four-year enrollment nearly flat (down 0.1% at nonprofits and 0.5% at for-profits), undergraduate certificates up 10.2%, and undergraduate Health Professions enrollment up 6.0% to 7.1% across award levels and institution types, its third straight year of growth.
Declining enrollment in higher education is therefore two stories. The first, a long contraction from 2010 to 2022, shows in the National Center for Education Statistics (NCES) counts: total fall enrollment at degree-granting Title IV institutions peaked in 2010 at 21,019,438, and for-profit undergraduate enrollment fell by more than half, from about 1.73 million in 2010 to about 828,000 in fall 2024. The second story, the demographic cliff, starts now and lands on top of it.
Read preliminary reports with care. In January 2025 the Clearinghouse withdrew a preliminary finding that fall 2024 freshman enrollment had fallen, after a methodology error; its corrected research found freshman enrollment rose. Private nonprofit four-year undergraduates were up 0.9% in the November 2025 preliminary report and down 1.6% in the January 2026 final. Plan from final reports.
Enrollment Cliff by State
WICHE projects that 38 states will graduate fewer students in 2041 than in 2023, and five large states (California, Illinois, Michigan, New York and Pennsylvania) account for about three-quarters of the national decline. By region, the West falls about 20%, the Northeast 17% and the Midwest 16%, while the South gains about 3%.
The steepest projected declines are in Hawai’i (33%), Illinois (32%), California (29%), New York (27%) and West Virginia (26%). The largest gains are in the District of Columbia (31%), Tennessee (15%), South Carolina (14%) and Florida (12%); Texas grows about 5%. Every state is in the table below.
See the Projection for All 50 States and DC (tap to open; red = fewer graduates, green = more)
| State | WICHE Region | Graduates, 2023 | Projected, 2041 | Change, 2023 to 2041 |
|---|---|---|---|---|
| Alabama | South | 52,954 | 54,262 | +2.5% |
| Alaska | West | 8,328 | 7,170 | −13.9% |
| Arizona | West | 82,942 | 81,428 | −1.8% |
| Arkansas | South | 33,861 | 32,330 | −4.5% |
| California | West | 477,531 | 339,022 | −29.0% |
| Colorado | West | 64,096 | 56,457 | −11.9% |
| Connecticut | Northeast | 44,185 | 42,405 | −4.0% |
| Delaware | South | 11,178 | 12,087 | +8.1% |
| District of Columbia | South | 5,747 | 7,529 | +31.0% |
| Florida | South | 221,601 | 247,409 | +11.6% |
| Georgia | South | 128,074 | 126,851 | −1.0% |
| Hawai’i | West | 14,290 | 9,582 | −32.9% |
| Idaho | West | 22,827 | 25,907 | +13.5% |
| Illinois | Midwest | 145,564 | 99,067 | −31.9% |
| Indiana | Midwest | 76,805 | 69,494 | −9.5% |
| Iowa | Midwest | 37,780 | 36,299 | −3.9% |
| Kansas | Midwest | 36,985 | 32,554 | −12.0% |
| Kentucky | South | 50,350 | 45,762 | −9.1% |
| Louisiana | South | 49,128 | 47,061 | −4.2% |
| Maine | Northeast | 14,198 | 12,718 | −10.4% |
| Maryland | South | 70,362 | 62,752 | −10.8% |
| Massachusetts | Northeast | 75,494 | 69,464 | −8.0% |
| Michigan | Midwest | 106,883 | 85,131 | −20.4% |
| Minnesota | Midwest | 65,884 | 58,295 | −11.5% |
| Mississippi | South | 32,152 | 27,003 | −16.0% |
| Missouri | Midwest | 67,229 | 58,880 | −12.4% |
| Montana | West | 9,980 | 10,520 | +5.4% |
| Nebraska | Midwest | 24,324 | 23,263 | −4.4% |
| Nevada | West | 33,256 | 30,156 | −9.3% |
| New Hampshire | Northeast | 15,492 | 13,964 | −9.9% |
| New Jersey | Northeast | 109,314 | 107,973 | −1.2% |
| New Mexico | West | 21,539 | 17,104 | −20.6% |
| New York | Northeast | 205,042 | 150,533 | −26.6% |
| North Carolina | South | 115,527 | 122,719 | +6.2% |
| North Dakota | West | 7,706 | 8,690 | +12.8% |
| Ohio | Midwest | 132,363 | 124,461 | −6.0% |
| Oklahoma | South | 46,211 | 46,250 | +0.1% |
| Oregon | West | 41,203 | 33,272 | −19.2% |
| Pennsylvania | Northeast | 141,089 | 116,928 | −17.1% |
| Rhode Island | Northeast | 11,213 | 9,492 | −15.3% |
| South Carolina | South | 53,941 | 61,735 | +14.4% |
| South Dakota | West | 9,705 | 10,357 | +6.7% |
| Tennessee | South | 70,783 | 81,459 | +15.1% |
| Texas | South | 393,596 | 414,861 | +5.4% |
| Utah | West | 47,592 | 44,908 | −5.6% |
| Vermont | Northeast | 5,765 | 4,921 | −14.6% |
| Virginia | South | 100,051 | 93,984 | −6.1% |
| Washington | West | 80,405 | 73,935 | −8.0% |
| West Virginia | South | 18,003 | 13,388 | −25.6% |
| Wisconsin | Midwest | 67,132 | 56,910 | −15.2% |
| Wyoming | West | 6,137 | 4,709 | −23.3% |
| West (region total) | 927,072 | 745,295 | −19.6% | |
| South (region total) | 1,443,229 | 1,479,933 | +2.5% | |
| Midwest (region total) | 760,548 | 638,923 | −16.0% | |
| Northeast (region total) | 621,474 | 518,267 | −16.6% |
Source: WICHE, Knocking at the College Door, 11th edition (December 2024), state tables for each region. Counts include public and private high school graduates; 2023 is the base year WICHE uses for state comparisons. Change computed from WICHE’s counts.
WICHE places North Dakota and South Dakota in the West, and Delaware, Maryland and the District of Columbia in the South. Its data pages (listed under Sources) have an interactive profile for every state.
California loses about 138,000 graduates a year by 2041, more than any other state. Most private career schools and many private colleges there also answer to the Bureau for Private Postsecondary Education (BPPE) for approval to operate in California, and BPPE’s annual reports ask for the enrollment and completion figures a shrinking pool moves first. In growing states the work runs the other way: a school that expands into one usually needs that state’s authorization, or a documented exemption, before it enrolls students there.
Why Is College Enrollment Declining?
College enrollment declines for different reasons in different sectors. Five causes appear in the sources this page uses.
- Fewer 18-year-olds. Births fell after 2008, and the high school classes from 2026 on are smaller (WICHE).
- A lower college-going rate. NCES counts 62.8% of 2024 high school completers enrolled in college the following fall, against 69.8% in 2016 (Digest of Education Statistics, table 302.10; survey estimates with standard errors of about 2 points).
- Price and value doubts. WICHE notes that among adults who never enrolled or stopped out, 85% cited cost as a key factor. Our guide to college ROI statistics covers that question.
- Students who stop out. The Clearinghouse counts 43.1 million Americans with some college and no credential (June 2025 report). Stop-outs fell in every sector except private for-profit four-year institutions (up 17.7%) and primarily online institutions (up 1.7%).
- Competition from public certificates. Enrollment at high-vocational public two-year colleges rose 13.6% in fall 2024 alone, and community college certificate enrollment grew 28.3% from fall 2021 to fall 2025. More students now take career programs at public colleges, usually at public tuition rates.
The cliff is a different event from the Covid-era drop: by fall 2024 total enrollment had “rebounded above pre-Covid levels,” the Clearinghouse reported, though undergraduates were still 1.0% below 2019.
Which Schools Feel the Enrollment Cliff First?
Schools that recruit mostly 18-year-olds from one shrinking state feel it first. Four risk markers stand out:
- tuition dependence, because enrollment is the revenue line;
- a recruiting area inside a high-decline state;
- a private four-year model competing with public institutions that gained students in fall 2025;
- programs with falling labor-market demand, where students can find a shorter or cheaper public certificate.
Private career and allied health schools that enroll mainly adults depend less on the 18-year-old pool than on stop-outs, career changers and workers sent by employers. The uncomfortable part is that public two-year colleges are growing in the same career fields, as the certificate figures above show.

How the Enrollment Cliff Affects Accreditation
Falling enrollment does not cost a school its accreditation by itself. No federal rule and no accreditor standard we have read treats a lower headcount as a violation. The risk runs through two things every recognized accreditor must judge: whether the school can pay for what it promises, and whether its students succeed.
Federal rules require accreditors’ standards to cover “fiscal and administrative capacity as appropriate to the specified scale of operations,” and student achievement, including “course completion, and job placement rates” where appropriate. Accreditors must also “at least annually, collect head-count enrollment data,” so an accreditor sees a decline every year, before any site visit.
Finances: The First Place a Decline Shows
For a tuition-dependent school, fewer students means less revenue within a term or two, and the accreditor reads it in the annual financial statements. For a nonprofit or for-profit school in the federal student aid programs, an auditor’s doubt about its ability to continue as a going concern reaches its institutional accreditor through the U.S. Department of Education, and the accreditor must then require a teach-out plan.
The Accrediting Commission of Career Schools and Colleges (ACCSC), which accredited the school Dr. Golbaghi founded, is a clear example. Its Standards of Accreditation (July 1, 2026 edition) require that “the financial structure of the school is sound,” and ACCSC reviews every school’s financial statements each year. It can require an institutional teach-out plan when it finds a school “may lack sufficient financial resources.” The Standards never mention an enrollment decline; it reaches ACCSC through these reviews and through the material-event notices a school files when its financial status could change.
Student Achievement: Small Cohorts Swing Rates
Completion and placement rates are calculated per program, so a smaller class makes every student count for more, and a program can fall below its accreditor’s benchmark without any change in teaching quality. ACCSC sets a 60% benchmark graduation rate for a seven- to nine-month program and a 70% employment benchmark for all programs. In a nine-month program with 40 students available for graduation, 26 graduates give 65%, and one more withdrawal still leaves 62.5%. With 12 students, 8 graduates give 67%, and one more withdrawal drops the rate to 58%, below the benchmark. ACCSC lets a school show mitigating factors, but “prolonged failure to meet a benchmark rate will result in a programmatic or institutional action.”
Closing a School, Location or Program Can Require a Teach-Out Plan
Federal rules require a school’s institutional accreditor to obtain a teach-out plan, and teach-out agreements where practicable, when a school “intends to cease operations entirely or close a location that provides one hundred percent of at least one program.” If a school closes without a teach-out, the accreditor must work with the Department and the state agency, to the extent feasible, to help students find reasonable ways to finish “without additional charges.” ACCSC also requires a programmatic teach-out plan when a school voluntarily discontinues a program.
On August 20, 2026, the Department proposed changes to these rules, including a deadline for teach-out plans after certain events and a new trigger when a school moves from full to provisional Title IV certification. As of October 15, 2026 they are proposals, not final rules.
State Approval and Title IV When Enrollment Falls
State Approval
A private school’s state approval agency may see an enrollment decline before its accreditor does, when the state collects enrollment and completion data every year, as California does. Requirements differ by state; our state approval guide covers each one.
BPPE, which grants approval to operate and is not an accreditor, asks each school’s annual report for “the total number of students enrolled,” the degrees and diplomas awarded, its annual financial statements and its School Performance Fact Sheet. That fact sheet goes to every prospective student before enrollment and shows completion, placement and license-exam passage rates, so a small-cohort swing shows up in front of applicants too. When a school decides to close, it must notify BPPE with a closure plan that provides for teach-outs or, where none is offered, refunds. Eligible California students who lose money when a school closes may also claim from the state’s Student Tuition Recovery Fund (STRF).
Title IV Financial Responsibility
Schools in the federal student aid programs must show the U.S. Department of Education that they are financially responsible. For a private school the main test is a composite score of at least 1.5, built from three ratios in the audited financial statements. A sustained enrollment decline can push the score down through lost tuition revenue, unless costs fall with it. The rules also list events that can require a letter of credit or other financial protection. Some are mandatory, such as a teach-out plan required “for reasons related in whole or in part to financial concerns.” Others are at the Department’s discretion and read like a description of a shrinking school:
- accreditor probation or a show-cause order;
- “a significant fluctuation” in Pell Grant or Direct Loan volume between award years;
- high annual dropout rates;
- discontinuing programs, or closing locations, that enroll more than 25% of the school’s Title IV students.
What to Document Before the Next Report or Site Visit
Accreditors and state agencies ask a school to explain a decline. These six records let it answer from evidence:
- Enrollment by program and start date, three years back, next to the WICHE projection for the school’s recruiting states.
- Completion and placement rates per program, with cohort sizes. Our guide to job placement rates in higher education covers why they matter for accreditation.
- A program review against labor-market demand and public certificates in the same field, which feeds a self-evaluation (self-study).
- A budget at lower enrollment, with the break-even number of students per program and campus.
- A draft teach-out plan for any program or location the school might close.
- An enrollment plan with board-approved targets. See our guides to a strategic enrollment plan and to strategic planning in higher education.
Planning a New Program or Closing One?
Many schools answer the cliff by changing their program mix: adding a certificate for adults, moving a program online, or closing a location. Each change can need state approval and accreditor approval before students enroll. We research which approvals your change needs in your state and help your team prepare the applications. Dr. Golbaghi personally reviews every curriculum we help a school develop through our curriculum development work.
Enrollment Cliff: Frequently Asked Questions
How Long Will the Enrollment Cliff Last?
WICHE projects declines through 2041, the last year in its current projections. After a drop from 2025 to 2028, graduate numbers are fairly stable until about 2035, then fall again.
Is College Enrollment Down in 2026?
Not nationally: the Clearinghouse reported total enrollment up 1.0% in fall 2025 and in spring 2026. The declines are in private four-year undergraduate enrollment (fall 2025) and master’s programs (spring 2026). Fall 2026 figures arrive in late October 2026 (preliminary) and January 2027 (final).
What Is the Difference Between the Enrollment Cliff and the Demographic Cliff?
“Demographic cliff” names the cause, fewer 18-year-olds; “enrollment cliff” names the effect on colleges. Enrollment can fall faster or slower than the population, depending on how many graduates go to college and how many adults return.
Which Schools Are Most Likely to Survive the Enrollment Cliff?
Schools with the opposite of the four risk markers above: revenue that does not depend on one entering class, recruiting areas in states WICHE projects to hold steady or grow, programs tied to occupations with demand, and an adult market as well as an 18-year-old one.
Which Colleges Are in Danger of Closing?
No official list predicts closures, and this page names no schools. The public warning signs are federal financial responsibility results, accreditor actions and monitoring, and state agency records. A school that sees them should prepare a teach-out plan before anyone asks for one.
Does Declining Enrollment Affect Accreditation?
Not by itself. It affects two of the areas accreditors must judge, financial capacity and student achievement, and federal rules require accreditors to collect headcount data every year.
About the Author
Dr. Ramin Golbaghi is the Founder and CEO of Accreditation Expert Consulting. He founded and led a private postsecondary institution and, as its owner, personally obtained six approvals: BPPE approval to operate, ACCSC institutional accreditation, Title IV certification, VA education benefits approval, WIOA/I-TRAIN workforce eligibility, and SEVP certification.